My Portfolio
CHARTING TOOLKIT
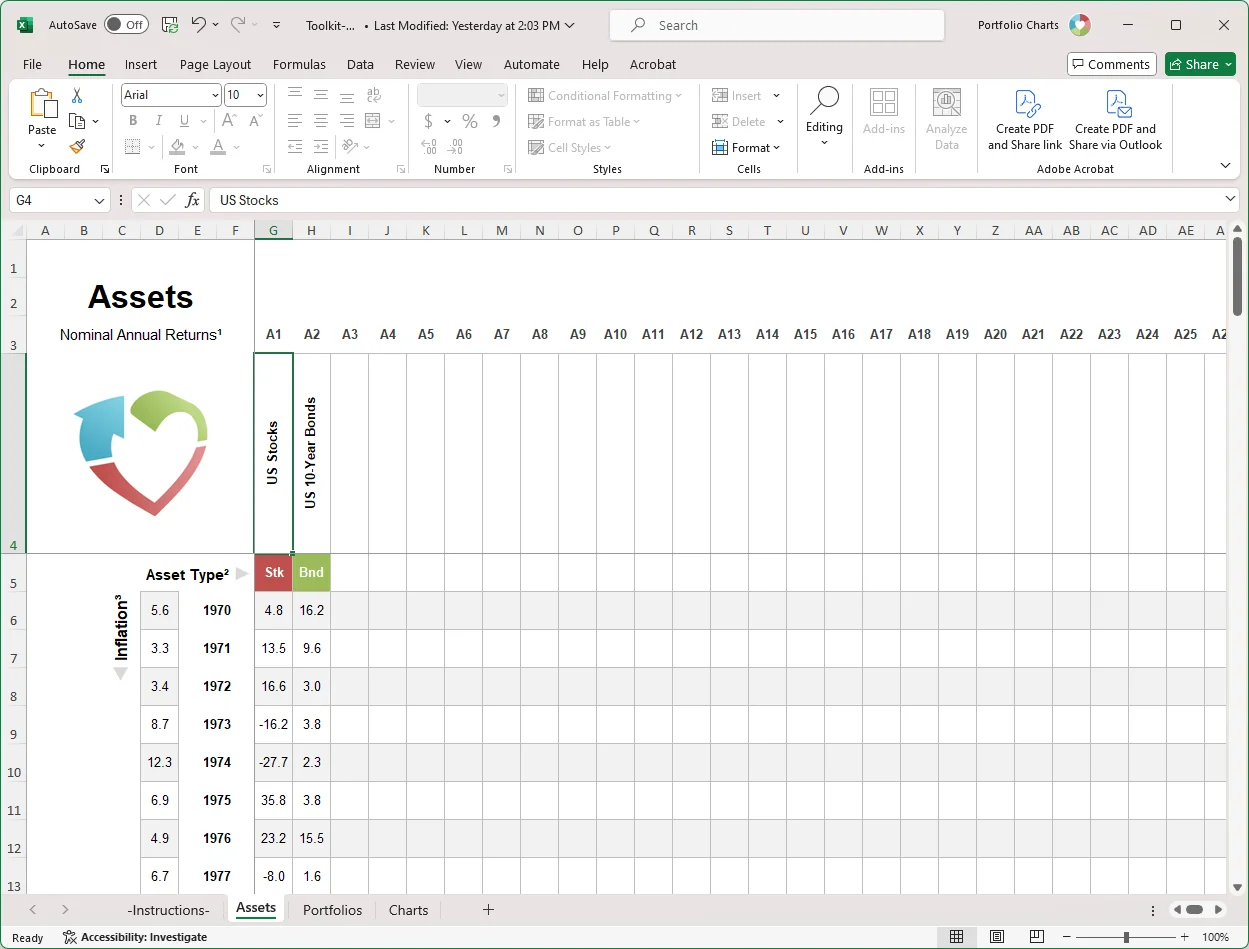
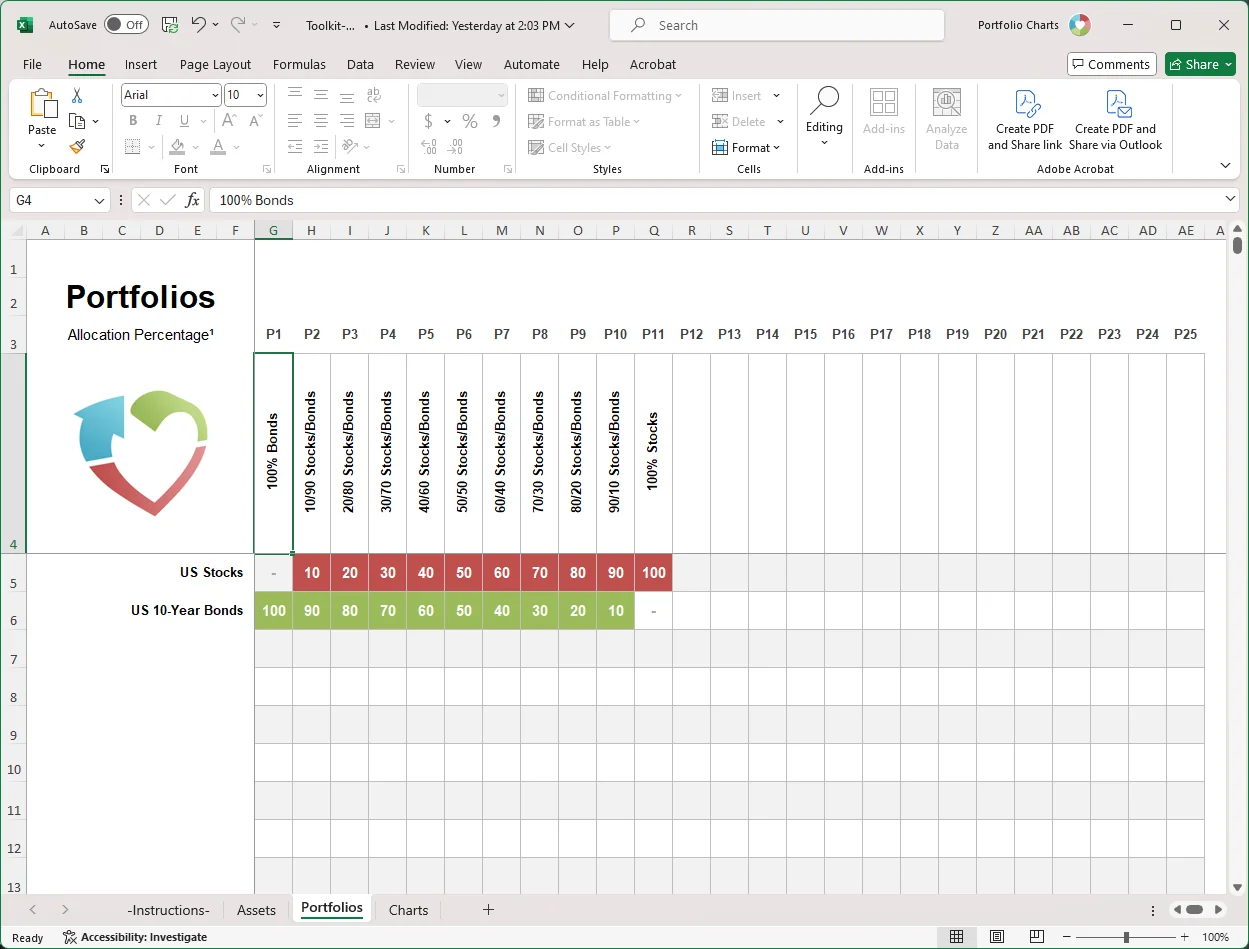
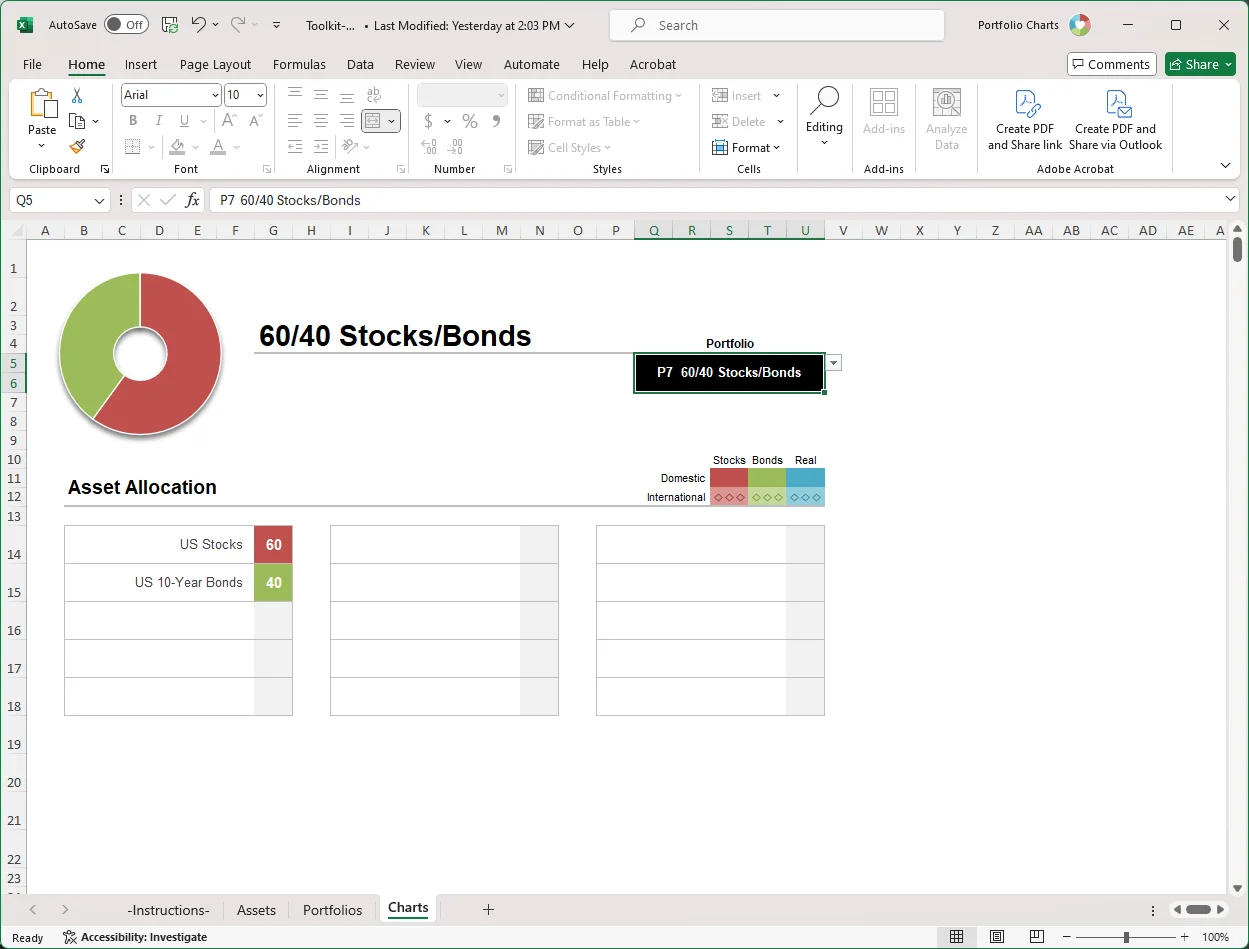
As a companion to the My Portfolio chart online, this is an Excel template that creates a custom version using annual data that you provide. You can save up to 50 asset series and 25 portfolios. Use it to study the performance of your favorite funds, unique asset mixes, and own calculations.
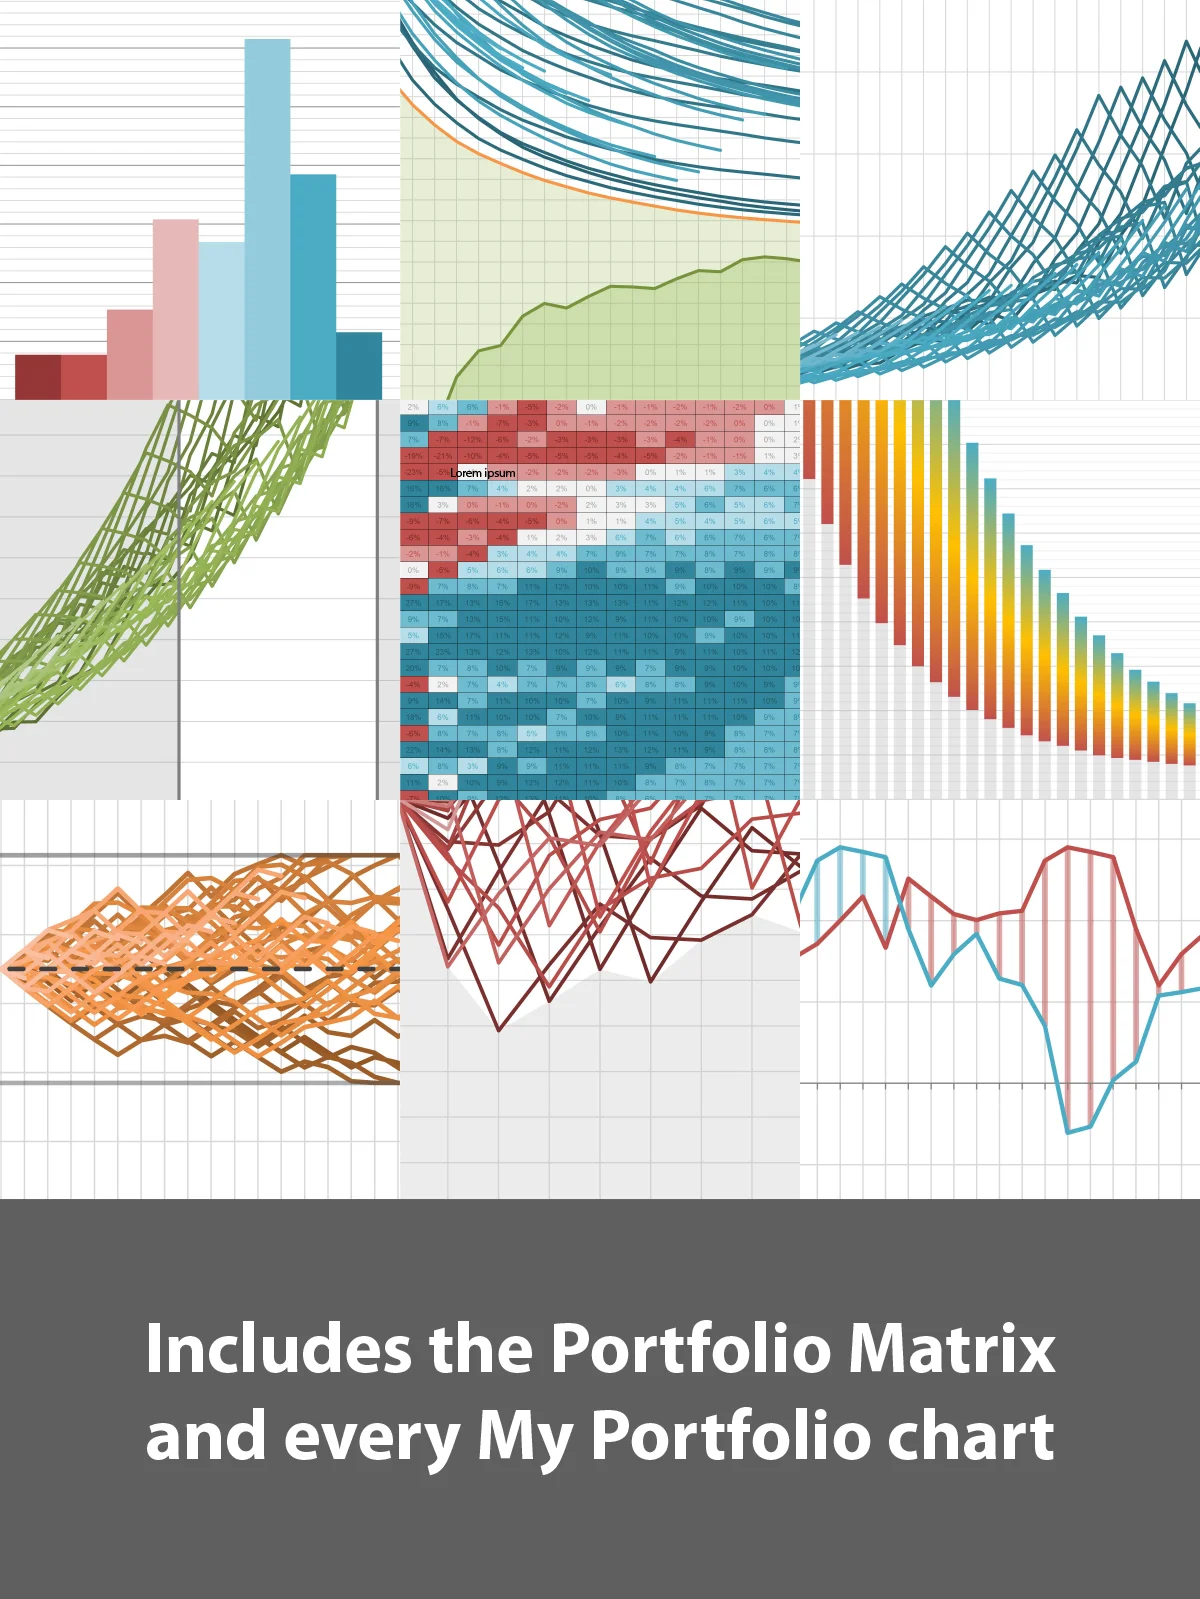
While My Portfolio online is for members-only, the Toolkit version does NOT require a membership to purchase! It includes every chart in the "Included Charts" note under My Portfolio on the Charts page, and it also includes the Portfolio Matrix.
WHAT YOU'LL NEED
- Requires the most recent Microsoft Excel. You can use it online with a free Microsoft account, but offline use requires Microsoft 365 to enable the latest functions. Works with both PC & Mac.
- Source data is NOT included. But the Toolkit will help you manage your own collection. Check out the Free Data Sources, and be sure to try the Data_Series sheet in the free Simba Spreadsheet for a major head start.
BEFORE YOU BUY
Read the walkthrough, try the free sample, and contact me with any questions. I'm happy to help!
Out of Stock